⚡ TL;DR – 30-Second Summary for Busy Bruxers!
Zerene measures: The force your jaw applies during sleep, captured as pressure patterns (it measures even more than this but we will stay focused today)
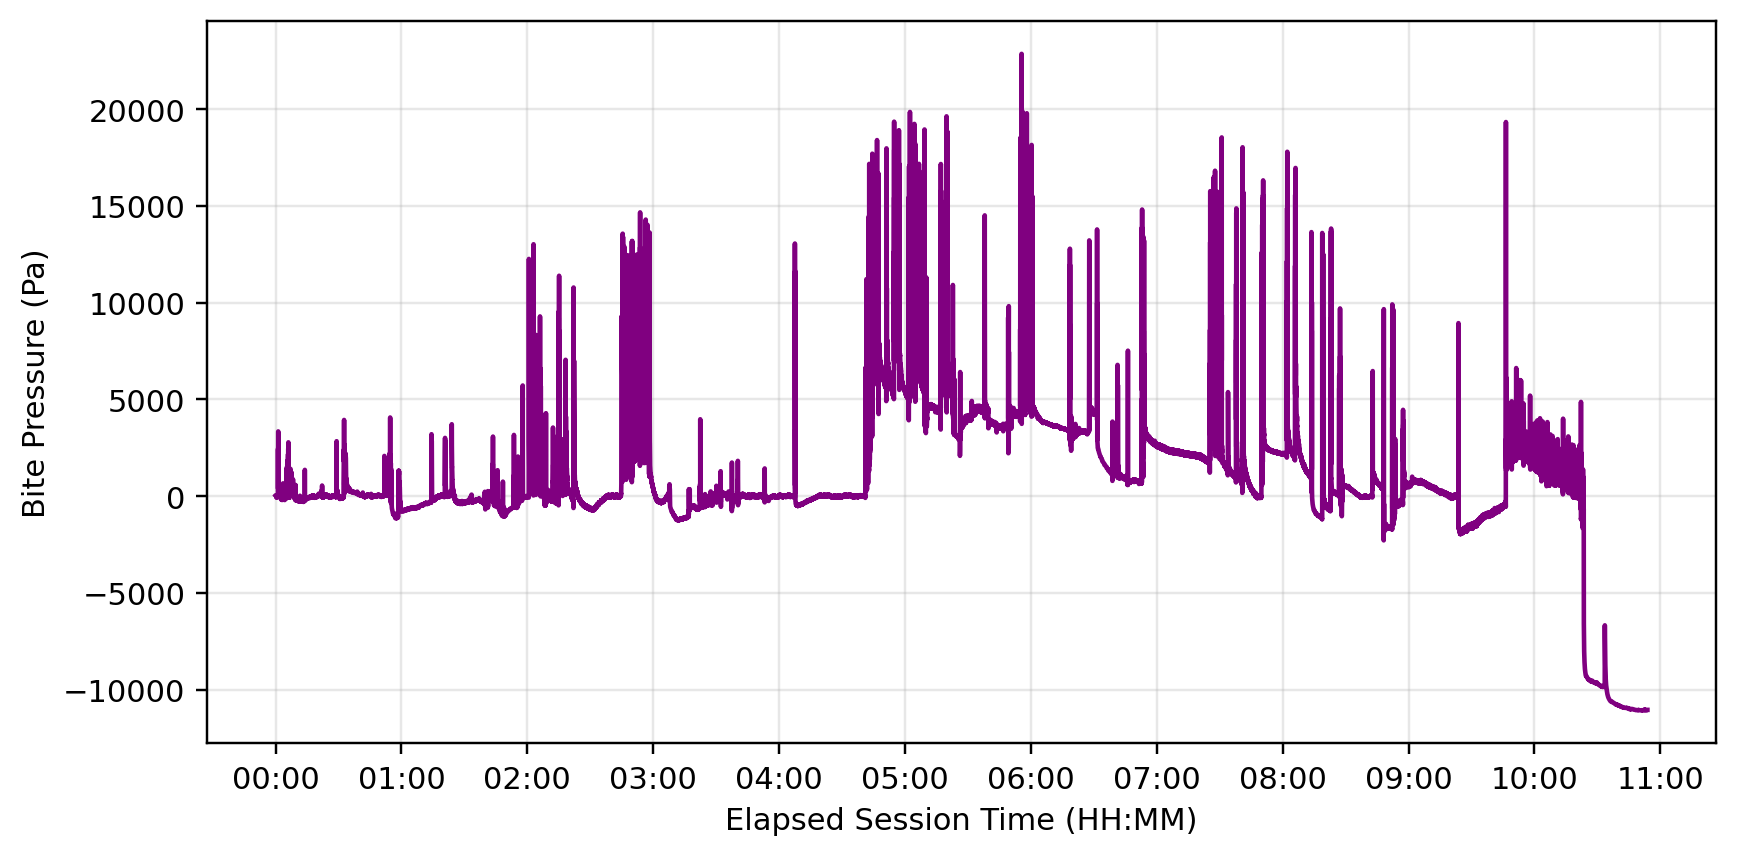
What the purple graph shows: Every clench, grind, and quiet moment of your night
What you’ll learn: When your jaw is working overtime – and when it’s finally resting
Why it matters: Understanding these patterns is the first step to reducing the damage bruxism causes to your teeth, jaw, and sleep quality
Last Tuesday at 2:47 AM, your jaw clenched with the force of biting into a tough apple. At 3:12 AM, it ground back and forth for 90 seconds straight. At 4:30 AM, it finally went quiet for a blissful 35 minutes of deep sleep.
You remember none of this. But your Zerene does.
Your Zerene gives you something you’ve never had before: a complete record of your jaw’s nighttime activity. Think of it as a fitness tracker for your teeth – except instead of counting steps, it’s tracking something most people have no idea is even happening.
This guide will help you become a detective of your own sleep patterns. You’ll learn to read the peaks and valleys of your nightly graph like a story—because that’s exactly what it is.
The Invisible Night Worker
During the day, your jaw has one job: chewing food. At night, it’s supposed to clock out. But for millions of people, the jaw pulls an unauthorized night shift – clenching, grinding, and applying force that serves no purpose except wearing down your teeth and stressing your jaw.
This is called bruxism, and it’s been nearly impossible to measure – until now.

How Zerene Captures Your Night in Data
Inside your Moon Module sits a tiny pressure sensor that captures changes in the pressure between your teeth when you clench and grind in your sleep.
We measure this pressure in Pascals (Pa) – the same unit scientists use to measure everything from blood pressure to ocean depth. You don’t need to memorize the numbers. What matters is watching how your patterns change over time.
Raw pressure data is messy – full of noise and artifacts. So we clean it up through temperature compensation and filtering, leaving you with that clean purple line: an easy-to-read record of what your jaw actually did.
💡 Your Action Item
Don’t get hung up on the exact numbers. Focus on your trends – is this week calmer than last week? Are certain nights consistently better?
Reading Your Purple Line: A Detective’s Guide
Your nightly graph tells a story in three visual languages:
📊 Height = Intensity
Tall spikes mean strong bites. Small bumps mean lighter pressure. A 15,000 Pa spike? That’s like chomping down on a raw carrot – except you are chomping through your own teeth. A 35,000 Pa peak? That’s a jaw workout you didn’t sign up for.
🔢 Number of Peaks = Frequency
Count the spikes to see how often your jaw activated. Some nights have hundreds of events. Others have just a handful. Both tell you something important about what your body was doing.
📏 Width of Pattern = Type of Activity
Narrow, tall spikes → biting
Small sustained bumps → clenching
Broader, wavy sections → grinding/chewing patterns
The Three Behaviors Your Graph Reveals
1. Clenching: The Silent Crusher
Look for small bumps attached to a larger bite spike. These show your teeth stayed clenched even after the initial pressure subsided. Clenching is sneaky – it doesn’t make noise like grinding, but it puts tremendous sustained pressure on your gums and jaw joint. It can cause gum recession, root resorption, bone loss, and ligament damage.
Top victim: Your jaw muscles, gums, bones, and TMJ. This is often what causes that “tight jaw” feeling you wake up with.
2. Grinding: The Tooth Sculptor
Back-to-back bite-and-release events in rapid succession, lasting anywhere from a few seconds to several minutes. Your jaw is literally moving back and forth, scraping teeth against teeth.
Top victim: Your tooth enamel. This is what creates those worn, flattened edges dentists spot immediately.
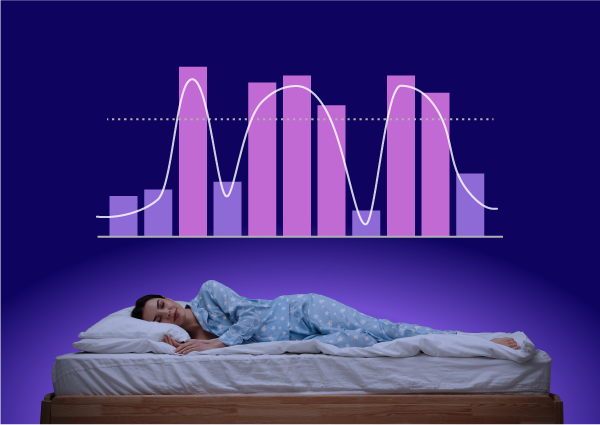
3. Deep Sleep Quiet Zones: The Goal
Periods where the purple line is nearly flat. These often correspond to deeper sleep stages lasting 20-40 minutes. Most bruxism happens during lighter sleep, so these “quiet windows” are positive indicators—your jaw is finally off duty.
💡 Your Action Item
Focus on bites above 3-5 kPa (3,000-5,000 Pa). Anything below that isn’t usually meaningful activity.
Training Your Jaw to Stop: Understanding Training Mode
Some nights, you’ll notice a gray shaded area over part of your graph. This is you in training mode – actively teaching your jaw to break the bruxism habit with Zerene as your sidekick.
How Biofeedback Actually Works
Think of it as a gentle tap on the shoulder getting your body’s attention. When pressure rises above your personalized threshold, the Moon Module delivers a customizable vibration. You probably won’t consciously notice it – but your jaw will.
Reading a training graph:
- Gray area = Active biofeedback training zone
- Thin purple lines in gray area = Success! You released pressure quickly after feedback
- Multiple thick purple lines reaching into gray = Biting/clenching periods where biofeedback activated but response was limited – this may indicate the need for changes to your training details
Over time, you’re looking for:
- Fewer thick lines piercing the gray area
- More thin lines (quick releases)
- Shorter overall line segments
- A lower Z-Score (more on that next)
💡 Your Action Item
Most users are shocked to discover their device was actively vibrating from 20 or 30, even up to hundreds of times a night – and they only consciously noticed it once or twice. Your subconscious is doing the work.
Your Z-Score: The Nightly Report Card
If your graph is the detailed story of your night, your Z-Score is the headline. It’s a single number that combines how hard and how long you were biting.
Higher Z-Score = More total jaw activity
Lower Z-Score = Calmer night

How We Keep Your Score Accurate
Not all pressure events are real bruxism. Sometimes your device shifts. Sometimes there’s an outlier event that doesn’t represent your typical behavior. Our system automatically identifies and removes these periods.
On your graph, you’ll see a dashed box around any segment we’ve excluded – usually because the device was removed or experienced an atypical event. This ensures your Z-Score reflects only the meaningful parts of your night.
💡 Your Action Item
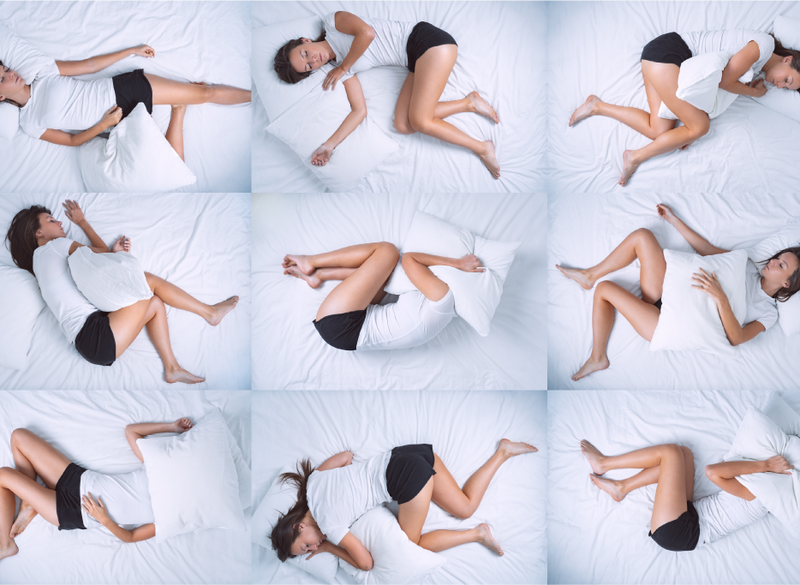
Don’t anchor to any single night’s score. Bruxism varies based on stress, sleep position, alcohol, and dozens of other factors. Watch your 7-day and 30-day trends instead.
Questions You’re Probably Asking
You’re Now a Sleep Detective!
Every morning, your graph tells you what happened while you were unconscious.
Over time, you’ll start connecting the dots: “That stressful Tuesday always shows up as grinding at 2 AM.” “When I skip my night routine, I see more clenching.” “That three-day vacation? Look how quiet my jaw was.”
This is data that has never existed before—and it’s all yours.
Questions? Confused by something in your graph? Our team is here to help anytime. Contact Us →